Answers
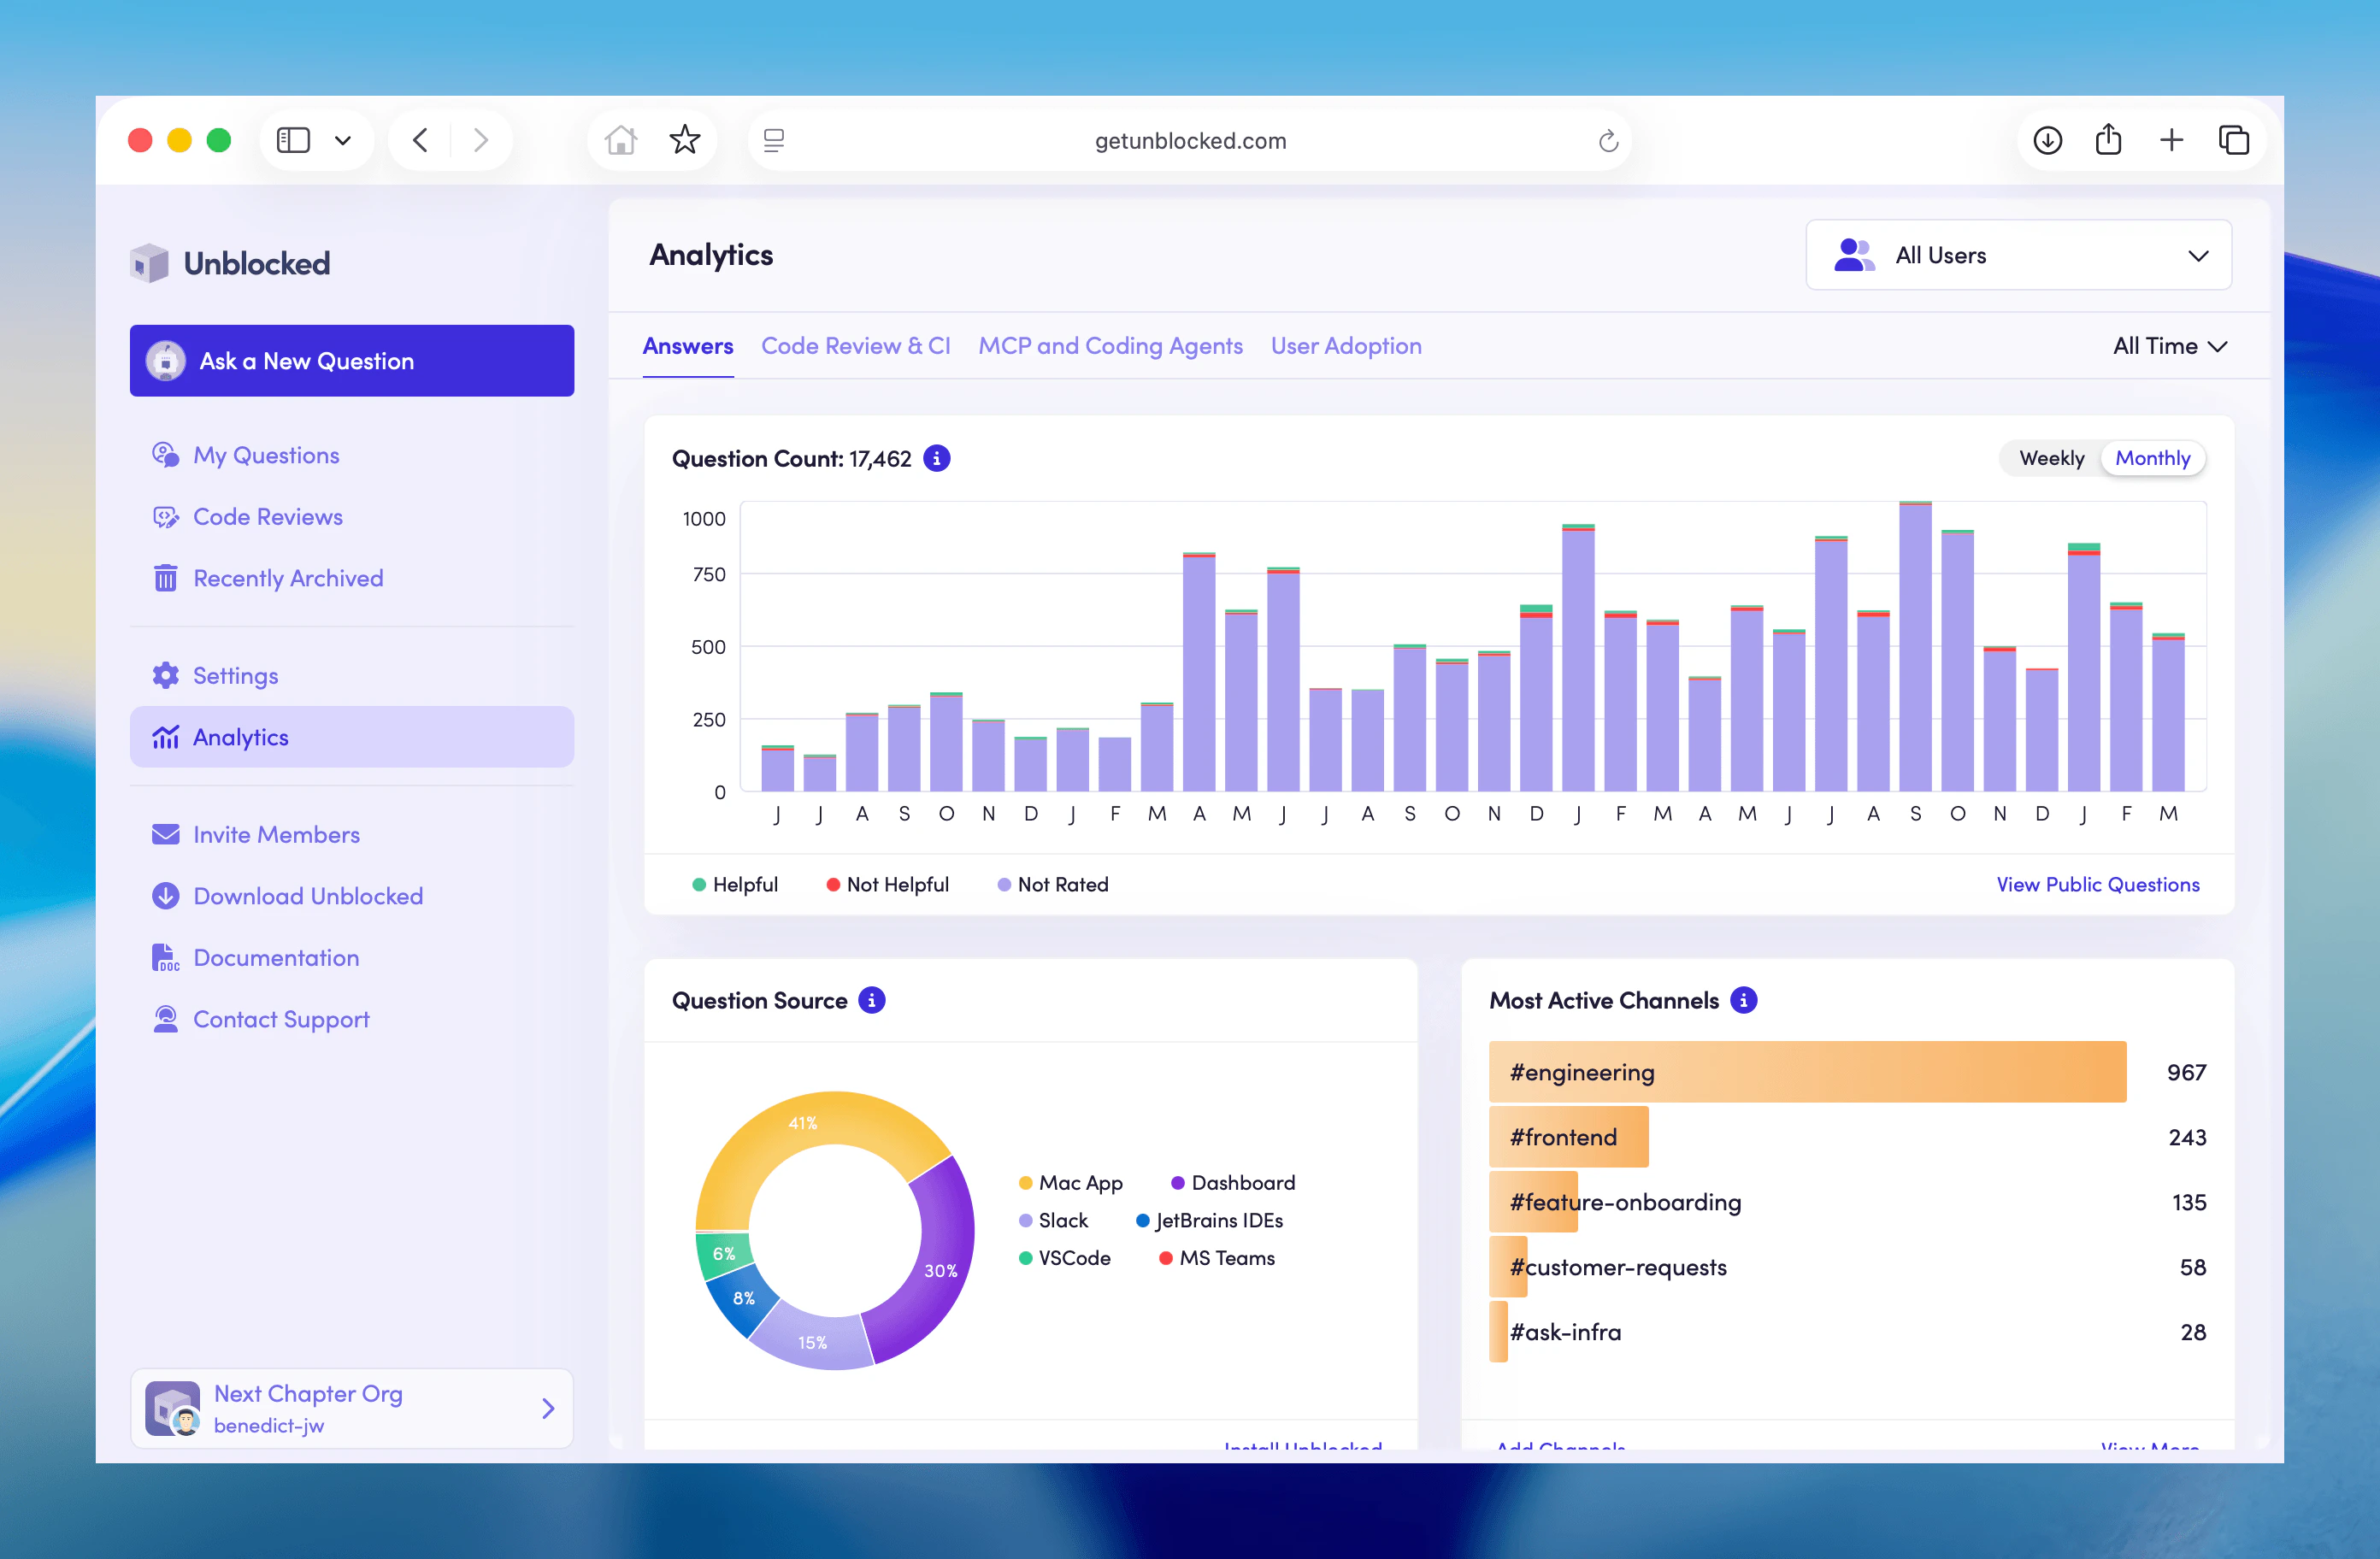
- Question Count: Shows the total number of questions answered during the selected time period. Hover to see a breakdown of how your team rated those answers: helpful, not helpful, or unrated.
- Question Source: Shows the distribution of questions across different interfaces: the Unblocked web dashboard, the Unblocked Mac app, and Slack and Microsoft Teams. This helps you understand which platforms your team uses most often.
- Most Active Channels: If your team uses the Slack integration, this chart shows which Slack channels generate the most Unblocked answers. This helps you see where your team uses the Slack integration most frequently.
Code Review
- Pull Request Review Count: Shows the total number of pull requests reviewed during the selected time period.
- Issues Found: Shows the total number of issues found during the selected time period.
- Review Feedback Sentiment Over Time: Shows how review feedback sentiment changes over time.
- Review Issues by Category: Breaks down review issues by category to highlight the most common types of feedback surfaced during code review.
- Review Issues by Repository: Shows which repositories received the most review issues during the selected time period.
Continuous Integration
- Report Count: Shows the total number of CI Failure Agent reports generated during the selected time period.
- Issues by Category: Breaks down CI issues by category to show the most common types of problems found in CI reports.
- CI Issues by Repository: Shows which repositories generated the most CI issues during the selected time period.
- CI Feedback Sentiment Over Time: Shows how sentiment in CI feedback changes over time.
MCP and Coding Agents
- MCP Tool Calls: Shows the total number of MCP tool calls made during the selected time period.
- MCP Usage by Coding Agent: Breaks down MCP usage by coding agent to show which agents are generating MCP activity.
User Adoption
- Distinct Active Users by Product: Shows the number of distinct active users over time for each product category: Answers, CI, Review, and MCP.